OK.Wahl
Internetpräsentation
Version 2.1.5
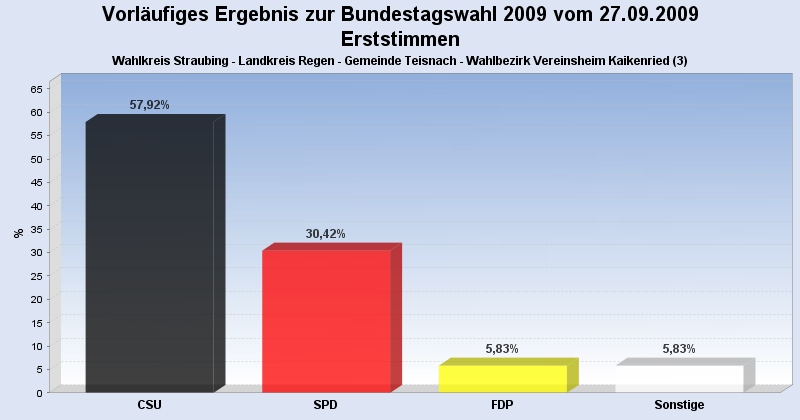
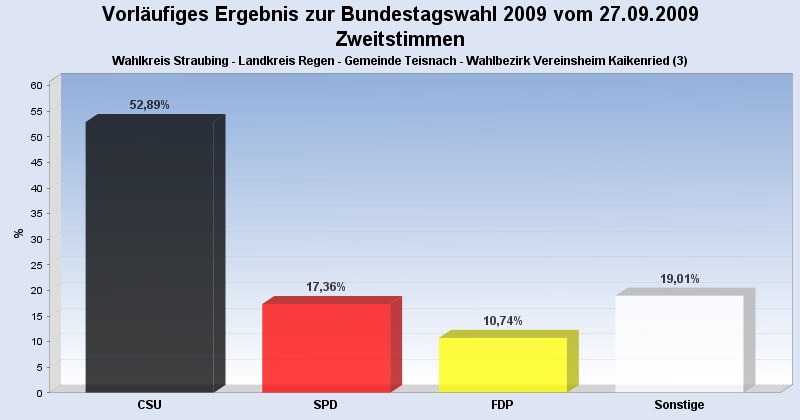
Vorläufiges Ergebnis zur Bundestagswahl 2009 am 27.09.2009
Wahlkreis Straubing - Landkreis Regen - Gemeinde Teisnach - Wahlbezirk Vereinsheim Kaikenried (3)
Wahlbezirk ausgewertet.
Wahlbeteiligung, Stimmzettel, Stimmen
| Wahlbeteiligung: | 47,13% |
|---|---|
| Stimmberechtigte: | 522 |
| Wähler: | 246 |
| Ungültige Erststimmen: | 6 |
| Gültige Erststimmen: | 240 |
| Ungültige Zweitstimmen: | 4 |
| Gültige Zweitstimmen: | 242 |
Erststimmen nach Wahlvorschlag
| Partei | Erststimmen | Prozent | |
|---|---|---|---|
| 1 | Hinsken, Ernst (CSU) | 139 | 57,92% |
| 2 | Adam, Michael (SPD) | 73 | 30,42% |
| 3 | Frankenfeld, Philipp (FDP) | 14 | 5,83% |
| 4 | Grundl, Erhard (GRÜNE) | 6 | 2,50% |
| 6 | Roßmüller, Sascha (NPD) | 5 | 2,08% |
| 5 | Kuschke, Dietmar (DIE LINKE) | 3 | 1,25% |
| 17 | Fahrner, Florian (ödp) | 0 | 0,00% |
| 20 | Kanneder, Harald (FÜR VOLKSENTSCHEIDE) | 0 | 0,00% |
Zweitstimmen nach Wahlvorschlag
| Partei | Zweitstimmen | Prozent | |
|---|---|---|---|
| 1 | CSU | 128 | 52,89% |
| 2 | SPD | 42 | 17,36% |
| 3 | FDP | 26 | 10,74% |
| 4 | GRÜNE | 11 | 4,55% |
| 5 | DIE LINKE | 8 | 3,31% |
| 6 | NPD | 6 | 2,48% |
| 7 | REP | 5 | 2,07% |
| 18 | PIRATEN | 5 | 2,07% |
| 9 | BP | 4 | 1,65% |
| 17 | ödp | 3 | 1,24% |
| 8 | FAMILIE | 2 | 0,83% |
| 15 | DIE VIOLETTEN | 1 | 0,41% |
| 16 | Die Tierschutzpartei | 1 | 0,41% |
| 10 | PBC | 0 | 0,00% |
| 11 | BüSo | 0 | 0,00% |
| 12 | MLPD | 0 | 0,00% |
| 13 | CM | 0 | 0,00% |
| 14 | DVU | 0 | 0,00% |
| 19 | RRP | 0 | 0,00% |
- Stand: 27.09.2009 21:16:50